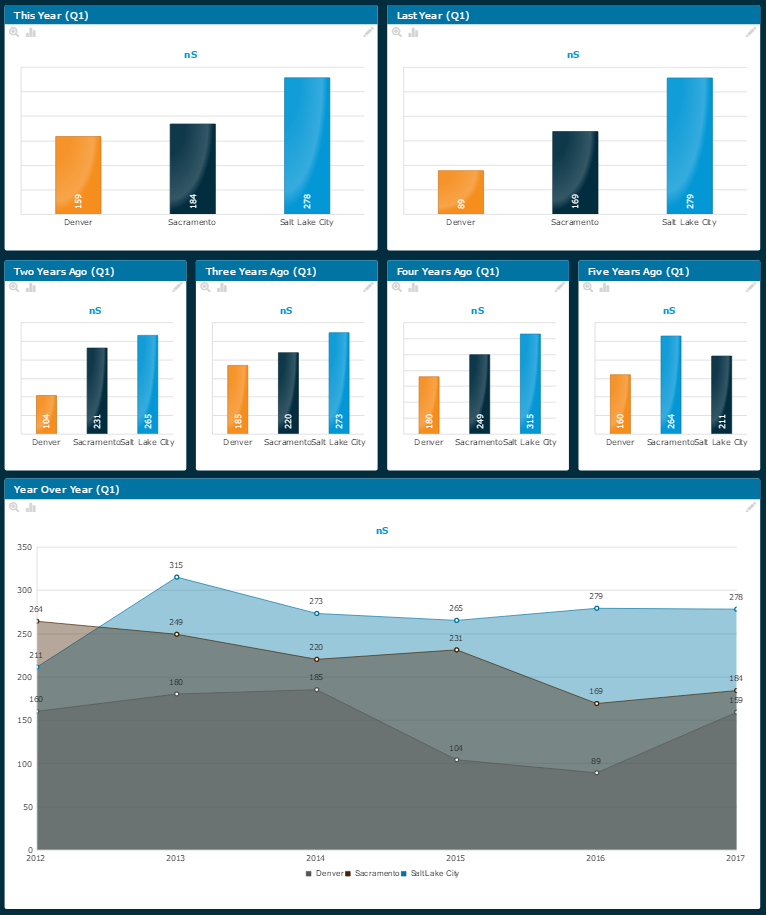
Learn from the past or you’re destined to repeat it. TrackResults’ new Speed Date Ranges now give you the option to look back as far as Five Years. That’s a lot of data in very little time! Try it out by running your favorite analytics view, select a date range like Current Month or Last Quarter, then flip through the years and watch your numbers roll.
Tip from the Pros (YoY KPI’s At-A-Glance):
Setting up comparative analytics is a must. You can do just that by using the speed date ranges combined with the dashboard, and report visualization tools. If you want to see how your Teams or Sales Centers are performing year over year, start by setting up a dashboard pane to display your favorite KPI and pick a rolling date range like “Last Quarter” of “Current Year”. Once you have the pane created you are ready to compare. Next, all you need to do is click the copy pane icon, then:
1) change your Pane Title,
2) flip to the Last Year option in the speed date range,
3) and save by clicking “Copy to New Pane”.
That’s it! Now you have two identical panes looking at the same parameters, but for This Year and Last Year. Repeat as necessary until you have all six years of data showing on your dashboard.

