I’d like to start by stating that this was just a teeny error, a simple oversight that could happen to absolutely anyone. If you love stories about Microsoft Excel, get excited! Or just hang with me for a few sentences and I will reward you with a great opportunity to laugh at my error, which again we’ve all agreed was minuscule.


I’m fortunate to have the opportunity to be invited to brainstorm sessions with my mentor, who also happens to be my CEO. During this particular session, I was tasked with flushing out a simple and effective formula to correlate the products of datasets throughout a workbook we’d been working on. To be honest, I was feeling rather optimistic and felt I knew more or less how to write something that would accomplish the task at hand.


It’s almost funny how quickly reality sets in when you hit the “enter” key on a formula you’ve just written and Excel boldly declares that your product is “FALSE”.  Now, had I been solving for a “True” or “False” this would have been terrific, but this particular Newtonian masterpiece was designed to provide a numerical value, of which “False” is decidedly not. I raced back through my formula, and subsequently every other formula that my useless jumble of code had derived data from, to find no errors.


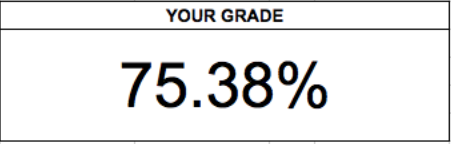
As my CEO peered over my shoulder, presumably questioning his previously brilliant decision to hire me, it hit me like a ton of bricks; my formula was based on what my eyes saw, rather than what the actual value was. The value I was reading, 75.38%, fell in the parameters of the data set I was solving for, but you know what didn’t fall in that data set? .7538. This simple oversight is why my brilliant formula was reading FALSE, rather than producing the grade the formula was designed to show.

kells

The reality is that I made an error, and had it not been for the fail-safe, it could have cost us money. I managed to not account for the fact that the “number” I was reading from an Excel sheet was represented as something that, numerically, it was not. Simple enough for anyone to do, I mean really simple like I’m sure it happens to everyone…

I am lucky to regularly work with a brilliant group of people who just happen to clean, manage, and normalize complex sets of data. Their lives are dedicated to ensuring the consistency and accuracy of each. I made a simple human error, which compromised my data. I was fortunate that the tolerance of our data sets was tight, so anything outside of the correct answer would provide a “FALSE”. Long story short, it helps to have procedures in place to ensure that the data you’re using to make important decisions, hasn’t been compromised.


We are fortunate to conduct business at a time where many of our predecessors have already implemented SOPs to limit many errors, but as technology inevitably advances we are faced with new potential pitfalls as well as the resurfacing of issues from bygone eras. We hire the best people, use the best programs, replaced the punch cards with fingerprint scanners, Rolodexes with CRMs, and work harder and smarter than ever before. The only part of this equation that creates a problem is that at the end of the day, we’re all human.


Terms like data breaches can force us to look at our processes, but they aren’t the only threat to a company’s data. The steps we take to keep the data our teams collect and input from being corrupted or inaccurate is something that is commonly overlooked. Everything from customer information to payroll and accounting is susceptible to human error, and it’s imperative that we have processes and fail-safes in place to keep these errors from damaging our bottom lines. Just remember, it’s important to make sure we have multiple processes in place to ensure our data is clean and accurate; all it takes is a ring finger inadvertently hitting delete to take us from profit to loss.

activity-analytics-business-401683

Collecting and analyzing data gives you important insights into trends in your business, which allows you to make more informed decisions for its future. Business Intelligence software helps you simplify these processes to translate data into critical information in real-time. Here are three signs you’re ready for a BI solution.

1. Your Reports Can’t be Constructed Fast Enough

You have data that needs to be analyzed and used to construct meaningful reports. You inform your IT department of the required report, and they let you know that it will be ready for you in three days. Three days later, while reviewing the report you realize that there is missing information, or that the information in the report is not displayed correctly. You then need to send it back to IT for the changes to be made, which will take another day or two. In some cases, it may take IT multiple edits to create the report that you envisioned which wastes precious time and resources. All the while you’re losing the ability to use the report for time-sensitive decisions. BI removes these problems from the data equation, at the same time allowing you to create and edit the reports instantly using real-time data.

2. Your Data and Reports are Inconsistent 

Inconsistent data leads to inaccurate reporting, which can then lead to making misinformed decisions solely based on faulty information. Inconsistent data can be the result of complex processes, or simply human error. BI software centralizes your data and establishes automated and streamlined processes, eliminating inconsistencies in how your data is reported.

3. Can’t make sense of your data- Are these fields consistent?

Your data is spread across many business applications; each application serving unique and vital functions. Aggregating and organizing the totality, sourced from each platform, is generally impossible as each data set needs to be converted to a common “language”. The goal is to make it possible to easily manipulate and make sense of one of your most valuable resources. BI software converts the data sets, allowing you to leverage the data you have already collected. Accurate reporting provides insight into your business which gives you the power to make the best decisions for your business.

Final Thoughts

Informed businesses look to gather data and analyze it to make more educated decisions regarding all aspects of their business. Optimizing this process using a BI solution also enables the mining of even more information out of their data while simplifying the processes surrounding the reporting and analysis. If you see the value BI can bring to your business, make sure your business is prepared to adopt it. Creating a detailed strategy for your BI solution is possibly one of the most important steps to complete prior to the adoption or construction of a solution. See our article “5 Topics to Consider About Your Data Before BI” to see how you can further prepare for a BI software solution.


We’re all looking for the best way to ensure our companies are as productive and efficient as possible. Taking advantage of Business Intelligence software has become a common vehicle to increase our bottom lines and ensure we are allocating our resources in the proper places. What many companies find is that there may be some steps that may need to be taken when it comes to implementing BI. Some others just don’t feel like they’re ready, as they haven’t been given the opportunity to have their questions answered or had the necessary steps broken down in the appropriate terminology. There are many BI options to choose from, and each has their own advantages and limitations, so choosing the best fit can also seem daunting. What we want to share is that the path becomes much easier once you’ve taken the first and most important step; ensuring that your data is ready for BI software.

 
Every business is unique and has its share of complexities and challenges. The data being generated by every industry is different, it contains the jewels of information about various business processes and customers and is available in abundance in every division. A company’s success is highly dependent on the appropriate utilization of the data they have now more than ever, and a smart business intelligence solution that can quickly transform volumes of data into understandable graphical charts in real time is always a great investment.

Below are 5 simple and important topics you should consider about your data before selecting a business intelligence solution;

Sources:

What are your sources? Determine which data sources you currently have and decide which are necessary for your business intelligence strategy. The most common of these are:

  • Databases
  • Flat files
  • Web services
  • Other sources such as RSS feeds

Data Hygiene:

You need to be able to trust the data coming into your BI solution.  Customer data is the core of your organization. It allows you to engage with customers and prospects to deliver exactly what they need. Customer data is only as valuable as it is accurate, so it’s crucial that you have confidence in the data that is influencing your decisions. By cleansing your data, you will be able to ensure that the decisions you make are based on accurate reports. Having confidence in the ability to make key decisions based on factual evidence provides you with the ability to make the correct decisions to advance your company.

Timing:

How fresh does your data need to be? Do you need it near real-time or does daily/weekly/monthly suffice? This is something that many people overlook. Some decisions are actually better made by analyzing trends in past data, while others greatly benefit from instant reporting. Having both of these abilities is important, but looking at which set of data is best for each purpose will greatly increase the value the end result.One of the defining features of many BI platforms is the ability to generate real-time reports. This process used to be tedious and almost impossible for the casual user, but many platforms are now much more user-friendly, enabling just about anyone to query the database and create reports. Others prefer to have reports delivered from their BI analysis partners. Having a third party that delves into data and analytics provides yet another avenue for growth and opportunity.

Staging Area:

How much data will you need to be able to analyze at a given time? Are you able to stage the data inside a native BI platform i.e. Tableau Data Extracts OR do you need to host it in a separate platform i.e. Data Warehouse or Microsoft SQL Server? If you are combining from multiple data sources, we would highly recommend having some sort of data warehouse.A staging area is mainly required in a Data Warehousing Architecture for timing reasons.  In short, all required data must be available before data can be integrated into the Data Warehouse. Due to varying business cycles, data processing cycles, hardware, and network resource limitations and geographical factors, it is not feasible to extract all the data from all Operational databases at exactly the same time.

Support:

Do you have support? This may seem like an odd question but the reason why most analytics workflows fail is from lack of support. It doesn’t matter if you can get the data once and build beautiful reports if you can’t then repeat the processes. The setting of an organizational support structure for your BI platform is key.


Best Value Travel Club is successfully selling the Saveon travel club product in their market since this Spring. They have decided that they need to manage the customer experience and can do it better than Saveon can. They have hired two fulfillment companies to assist their clients to use the product and have a good experience. One fulfillment company will use the Best Value database in TrackResults, while the other will use the VRS database in TrackResults. They will use the features of TrackResults to log calls and communications of every contact with clients while still having access to the sales history. This 360-degree view of the client is important to understanding and servicing the client.


TrackResults is working with a well known and respected industry professional Tom Carney on a new club called Palace Hotels and Residence Club with its first sales center located at the Luna Palace Hotel in Mazatlan Mexico. Palace will be using TrackResults to manage the sales and marketing operations and to generate the analytical reporting needed to win in a competitive Mexican market like Mazatlan.


TR


Companies often have objections to getting on board with business intelligence software. Either they have something else they are using or they already run these reports and have the data. What good does the data do if you are not properly using it to make smarter business decisions? Think of it as a puzzle, you know all the pieces are there to complete it, but you need to put them all together to create the final picture. Using business intelligence properly can have several benefits:

  1. Smarter decisions backed by facts – Once a company implements business intelligence protocols, management can see detailed and current data on all aspects of the business allowing for informed decision-making and validation of instincts.
  1. Increase profit margins – A business intelligence system can point out areas of loss that were unnoticed and/or identify low-hanging opportunities for increased sales.
  1. Better Human Resource Allocations – Business intelligence can improve efficiency within your organization and increase productivity. Traditional data gathering methods can be prohibitively time-consuming especially for small businesses who may not have the resources to give full attention to data reviews. With the right BI program running these reports only takes a few seconds allowing managers to be more productive on their own tasks.

TrackResults’ team of analysts and consultants have over 50 years of combined experience in helping their clients ensure that every possible dollar flows through to their bottom line. Contact Ryan Williams (ryan@trackresults.net or 801-244-1310) for information on how to be sure that you are capturing all of the revenue that you should be.

Bill Bailey a long time client and friend of TrackResults will be implementing TrackResults for a new sales operation in Litchfield IL. Leisuretime Travel is a startup operation by a team of experienced travel club salespeople. They are starting small and growing their marketing and will use TrackResults from ground zero to capture important information to run the day to day business as well as provide analytical reporting to be more sophisticated and competitive in their efforts.


More Questions than Answers When Reviewing Data? Good, you’re doing it right.

Here we go, another data guy writing another data article about data. Rather than bounce from buzzword to buzzword or tell you what your data should look like and what your people should be doing but aren’t, I thought we would spend our time together talking about my data and the rabbit holes that my team chases it down when looking for answers. Apparently, it has no regard for my status as a supposed data expert. The simplest data in my world is generally Google Analytics. Fortunately, this data is extremely current and very deep, meaning that it offers an endless number of rabbit holes down which one can get lost. Most people understand the basic metrics that are available in their Google Analytics dashboard; visits, bounce rate, time on site, etc… Typically, these are used to measure the effectiveness of one’s marketing and ensure the website converts visits to some action that correlates to revenue. Rather than discuss the basics, let’s look at the analytics for actual users of the TrackResults platform which is the true measure of the value we provide to our clients.

More often than not I find myself logging into Google Analytics because someone has asked me to find an answer to a specific question. Usually, something to the effect of “how many users log into TrackResults every day?” or “how long does the average user spend in TrackResults?” In case you’re wondering at any given time an average of 3,608 users are logged in and just over 20 minutes respectively would be the simple answers. Unfortunately, it gets considerably more complicated from there. The follow-ups range from “which day of the week do we see the most users?” (Monday No surprise here…you really shouldn’t need software to answer that) to “which mobile operating system is most common amongst our Mexican clients?” (iOS, twice as popular as the nearest competitor).

We are usually looking for answers to these questions because we are prioritizing development projects or making sure our servers are configured in the way that provides the fastest possible load times for our users. Sometimes we want to make sure that clients we haven’t heard from in a while are getting the most out of the system. If a number of sessions or average duration of a session are dropping it’s probably a good sign that we should reach out to them.

The examples above just scratch the surface of the data that is available and its uses. When a question arises, most team members have a theory as to the cause and solution. Often, the answers we find are perplexing and fail to support our original hypothesis. What happens when revenue is up and all of the corresponding metrics (site visits, conversions, and confirmation page views) are down? The first layer of data and often the second will not provide the answers you seek. Where do you go from there? How does my description of this situation compare to your experience? One of the perks of being the boss is that we have key staff that we trust to distill the raw data into the few KPI’s we really care about. Does that mean we should never look at the reports that they see? No. While executive summaries are an important and necessary tool, it is critical that decision-makers understand the reports from which the summaries are derived. If your car is making strange noises, you don’t assume that everything is fine because the check engine light isn’t on.

“Then On” pivoting is one of our most underplayed features that I have learned NOT to live without. In product, we constantly run checks in the various accounts as we push new features and bug fixes. To be honest, it pains me when I land in an account that doesn’t have the Then On reporting functionality. I’ve personally noticed a 30% increase in time to validate when Then On is not available…

Here are 4 ways I use Then On:

1) Comparison Analytics
How’s your year going so far? What months were strong and what months were weak? These questions are easy to answer in TrackResults, but when you also want to see Who, Where, What Campaign, Team, etc… drove or dove month over month, or week by week, you really need “Then On”.
 monthsSalesCenters
2) Data Validation
Are dispositions, or other sub data, being categorized correctly? Who is entering “dirty” data? Data accuracy is huge. If you are basing resource decisions like hire/fire or training directives off of dirty data, then fingers crossed you don’t accidentally let the best people go or waist time training the wrong person.
statusDispositions
3) Perspective
High-level data is great, but when you add depth you may find something unexpected.
image    >>    cigar
4) It’s Fast
Use row selection like a filter. Clicking modify and updating the filter criteria to single out the values you want to dig into is a great technique for the ear popping deep dives, but when you just want to get your feet wet and keep moving, try first setting the Report On by your primary dimension, then check a couple rows, and add a Then On criteria to drill in one layer deeper without leaving the view.