We’re all looking for the best way to ensure our companies are as productive and efficient as possible. Taking advantage of Business Intelligence software has become a common vehicle to increase our bottom lines and ensure we are allocating our resources in the proper places. What many companies find is that there may be some steps that may need to be taken when it comes to implementing BI. Some others just don’t feel like they’re ready, as they haven’t been given the opportunity to have their questions answered or had the necessary steps broken down in the appropriate terminology. There are many BI options to choose from, and each has their own advantages and limitations, so choosing the best fit can also seem daunting. What we want to share is that the path becomes much easier once you’ve taken the first and most important step; ensuring that your data is ready for BI software.

 
Every business is unique and has its share of complexities and challenges. The data being generated by every industry is different, it contains the jewels of information about various business processes and customers and is available in abundance in every division. A company’s success is highly dependent on the appropriate utilization of the data they have now more than ever, and a smart business intelligence solution that can quickly transform volumes of data into understandable graphical charts in real time is always a great investment.

Below are 5 simple and important topics you should consider about your data before selecting a business intelligence solution;

Sources:

What are your sources? Determine which data sources you currently have and decide which are necessary for your business intelligence strategy. The most common of these are:

  • Databases
  • Flat files
  • Web services
  • Other sources such as RSS feeds

Data Hygiene:

You need to be able to trust the data coming into your BI solution.  Customer data is the core of your organization. It allows you to engage with customers and prospects to deliver exactly what they need. Customer data is only as valuable as it is accurate, so it’s crucial that you have confidence in the data that is influencing your decisions. By cleansing your data, you will be able to ensure that the decisions you make are based on accurate reports. Having confidence in the ability to make key decisions based on factual evidence provides you with the ability to make the correct decisions to advance your company.

Timing:

How fresh does your data need to be? Do you need it near real-time or does daily/weekly/monthly suffice? This is something that many people overlook. Some decisions are actually better made by analyzing trends in past data, while others greatly benefit from instant reporting. Having both of these abilities is important, but looking at which set of data is best for each purpose will greatly increase the value the end result.One of the defining features of many BI platforms is the ability to generate real-time reports. This process used to be tedious and almost impossible for the casual user, but many platforms are now much more user-friendly, enabling just about anyone to query the database and create reports. Others prefer to have reports delivered from their BI analysis partners. Having a third party that delves into data and analytics provides yet another avenue for growth and opportunity.

Staging Area:

How much data will you need to be able to analyze at a given time? Are you able to stage the data inside a native BI platform i.e. Tableau Data Extracts OR do you need to host it in a separate platform i.e. Data Warehouse or Microsoft SQL Server? If you are combining from multiple data sources, we would highly recommend having some sort of data warehouse.A staging area is mainly required in a Data Warehousing Architecture for timing reasons.  In short, all required data must be available before data can be integrated into the Data Warehouse. Due to varying business cycles, data processing cycles, hardware, and network resource limitations and geographical factors, it is not feasible to extract all the data from all Operational databases at exactly the same time.

Support:

Do you have support? This may seem like an odd question but the reason why most analytics workflows fail is from lack of support. It doesn’t matter if you can get the data once and build beautiful reports if you can’t then repeat the processes. The setting of an organizational support structure for your BI platform is key.


Fast reporting that is vital to intelligent discourse and fact-supported decisions are now within reach. Anytime a group of company leaders meets to drive the progress of their business, it becomes an invaluable investment of time and money.

Limit Reporting Bottle Necks

Let’s face it, company meetings often reach dead ends or postponements on important decisions merely because the necessary data to back vital initiatives isn’t available at the moment it’s needed most. Because of this, action is often delayed missed, or else someone ends up going with what their gut is telling them.

Both outcomes are unfavorable, of course, and they can cost a lot of money and opportunity in the end. Not a single CEO, Vice President, or manager would tell you that going with his or her gut is the best way to make business decisions, and likewise, none would agree that timing isn’t imperative. So how can a company make fast, effective, fact-based decisions at the moment they need to be made? Well, often times they can’t, and it’s because they’re using the wrong tools.

A Revolution for Results

Here’s a typical example of how traditional business intelligence and analytical avenues can greatly hinder the progress of a company. Imagine this scenario: A group of executives gather for a meeting to discuss important matters directly affecting the growth of their business. The discussion turns toward a topic requiring supporting data to make the proper decision. However, the decision needs to be made by those in the meeting, and it needs to be made today, better yet—now.

Traditionally, the executives task their business analysts and engineers (IT) with finding out what data there is to support the idea being discussed. Once they’ve determined whether they may have the data they need, they then request the generation of a report that visualizes the information. Unfortunately, this report won’t materialize before the meeting is over, or even in a couple hours. This is because traditional forms of data mining and reporting involve business analysts and engineers, even before any sense can be made of the data points collected. What’s more, it takes both teams to build, decipher and deliver reports that reflect the data in a discernable way. The report workflow is so complex and involveing so many people and so much time. By the time the executives get any report back to support the concept, the burden of the delay may cost more than money. Meanwhile, they’ll stew over how long it takes to get what they need.

The Defining Difference

Now imagine that the same group of executives meets to discuss the same sort of trends and topics related to their business. Only this time, there’s one major difference. When the discussion reaches a topic that needs informations to craft an informed strategy, each individual in the room can quickly access numerable sources of data to support the discussion and the inevitable decisions to follow.

The information is accessed in real time, with each concept tested in detail immediately. The discussion is led to a data-supported and logical conclusion, and it’s all done through a convenient web-based application. This may sound like a stretch? Well, it’s not. Such a solutions actually exists, and it helps companies steer their business in the right direction faster and more efficiently than they ever could.

In some recent articles for Developments Magazine and The Resort Trades, the TrackResults team has been examining how to use your own business acumen in conjunction with TrackResults Data Analytics software to come to conclusions about your business that will raise the ROI in your business.

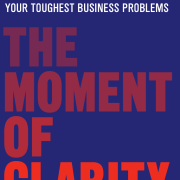
In this book, Christian Madsbjerg and Mikkel Rasmussen examine the human side of data analytics and why we might take into account the human sciences when deciding how to manage business decisions.

moment_of_clarity

The Moment of Clarity: Using the Human Sciences to Solve Your Toughest Business Problems

Fully Aware Intentions, Implemented in Unexpected Ways Over the past fifteen years, the six-burner gas stove and granite countertops have become essential symbols in millions of American homes. They signify gourmet family dinners and tell a story of a home in balance. The reality is that such showpieces are rarely used, at least not nearly as much as the microwave hidden away in the closet or the takeout menus taped to the fridge.

This book delves into the questions we raise every day as a data analytics company. How do you mix the uncertainty of human behavior with the hard numbers in your data to come out with actionable results?

Founding partner Drew Reynolds was a featured speaker on the Wednesday afternoon panel “The True Value of Data”. The talk was a high point for TrackResults. During his speech, Drew asked a very important question.

How can I get access to every single thing I want to make a decision on? “
He posed the question to the audience. Drew said: “Everyone in this audience has a great idea. Then he asked : What performance increases would you achieve if you were able to mine all of the great ideas that happen across your organization?  You make smart decisions all the time. “How would your business improve if you could leverage all those decisions?” His speech ignited the imaginations of all the attendees. drew-headshot-bio

The insight derived from using the  TrackResults analytics software is invaluable for timeshare industry decision makers. Managers and executives make informed decisions using their own empirical data, allowing them to maintain the highest efficiency, tweak operations and increase margins.

aocap-logo   Timeshare Software TrackResults attended the Asian Ownership Conference Asia Pacific (AOCAP) conference as key speaker in the “Technology Pot Pourri”  panel and forum.  The conference was centered around “Alternative Ownership: Building the Platform for Growth,” and was held at the world`s tallest hotel with the world`s fastest (ear popping) elevators, the Ritz-Carlton Hong Kong Hotel OCt 15 – 16th 2013.

This unique conference, focused on the latest developments and concepts in the vacation ownership industry. The conference shed light on some of the current challenges facing the industry , specifically in the technology sector. Two of TrackResults Co-Founders Drew  and Todd ( http://www.aocap.org/speakers/drew-reynolds/ ) presented education on the Big Data issues causing IT departments to ” circle the wagons”.

http://www.youtube.com/watch?v=AR6Ab2kNZWo   See the whole ” Big Data” video here …TrackResults Youtube Channel

Drew’s honest, humorous demeanor was captivating.

Orlando, FL (July 18, 2013) — TrackResults, a cloud-ware business application that specializes in tracking the performance of sales and marketing professionals at timeshare resorts, recently participated at Mexico’s leading vacation ownership industry trade convention.
The 27th Annual Asociación Mexicana de Desarrolladores Turísticos (AMDETUR) Convention was held June 19-21, 2013 at the Hilton Mexico City Reforma Hotel in Mexico City, Mexico. Referred to in English as the Mexican Resort Development Association.”

todd-AMDETUR2013

Todd R. of Timeshare Software TrackResults was invited to speak at the event, and as one of only a select few solo speakers, delivered an informative and inspiring presentation on the morning of the second day.

Fitting perfectly with the theme of the conference, Todd discussed the change that technology has had on the timeshare industry in recent years, especially because of advancements in sales management systems, and the levels of business intelligence now available to resort developers through their tour tracking system.

It was shown that not only are these statistics likely to change dramatically from one company to another, but also that they change quite dramatically between Eastern and Western Mexico.The presentation concluded with examples of how tracking all aspects of a sales professionals results could improve performance, efficiency and ultimately increase a resort developer’s volume per guest, thereby making them more profitable.

AMDETUR is a great venue for us to support our clients in Mexico. This forum was our first exposure of timeshare marketing and analytics discussed cross-country, and opening dialogue with resorts to compare trends in timeshare sales of Eastern and Western Mexico. We look forward to hosting a panel next year at AMDETUR, to explore how Mexican developers are using business intelligence to gain Volume Per Guest (VPG) lift, and increase marketing yields. Special thanks to Carlos and Romarico for their support,” said TrackResults.

For more information on TrackResults Software visit http://www.trackresults.net or call +1 888-819-4807 or visit their Facebook page at https://www.facebook.com/pages/TrackResults/130859730308862

What are Smart Goals?

S.M.A.R.T. is an acronym for the 5 steps of specific, measurable, achievable, relevant, and time-based goals. It’s a simple tool used by businesses to go beyond the realm of fuzzy goal-setting into an actionable plan for results.

Specific: Great goals are well-defined and focused. “Obtain 2 new billion dollar corporate clients in the Boston property insurance market” is more meaningful to mobilize your team than “Get more business.” Ryan Blair, The Goals Guy eloquently states,”Focus creates a powerful force: goal power. The moment you focus on a goal, your goal becomes a magnet, pulling you and your resources toward it. The more focused your energies, the more power you generate.”

Measurable: A goal without a measurable outcome is like a sports competition without a scoreboard or scorekeeper. Numbers are an essential part of business. Put concrete numbers in your goals to know if you’re on track. A goal white board posted in your office can help as a daily reminder to keep yourself and your employee focused on the targeted results you want to attain.

Attainable: Far too often, small businesses can set goals beyond reach. No one has ever built a billion dollar business overnight. Venture capitalists and angel investors discard countless business plans of companies with outlandish goals. Dream big and aim for the stars but keep one foot firmly based in reality. Check with your industry association to get a handle on realistic growth in your industry to set smart goals.

Relevant Achievable business goals are based on the current conditions and realities of the business climate. You may desire to have your best year in business or increase revenue by 50%, but if a recession is looming and 3 new competitors opened in your market, then your goals aren’t relevant to the realities of the market.

Time-Based: Business goals and objectives just don’t get done when there’s no time frame tied to the goal-setting process. Whether your business goal is to increase revenue by 20% or find 5 new clients, choose a time-frame to accomplish your goal.

Smart Goal Sample

So what does a smart goal look like? Based on the acronym, our example would state, ““Obtain 2 new billion dollar corporate clients in the Boston property insurance market by the end of this fiscal year through networking and marketing activities.”

Once your business goals are SMART, break down each goal into a specific set of tasks and activities to accomplish your goals. It’s important to periodically review your goals and make adjustments if necessary. Goal setting for your small business is an essential tool for success. Remember in the end to be SMART.

How many attributes does it take to generate 3 BILLION dollars in net sales?
( all numbers are approximate, using End date Dec 31, 2012)

Choo Choo train image  Last year alone TrackResults added the following growth factors to hit the aggregate milestones below: Our clients added $920 million in sales, 1.2 million new tours, 2,927 new liners, closers , and OPC’s working in 1,702 new venues, in 208 offices on 43 new domains.


$2,905,680,000
  (3B) sales ( Dollars) volume produced using TrackResults intelligence.
5,039,238   timeshare and travel club tours manifested
82,251  report combinations available selecting only 4 of these attributes.
26,299  timeshare and vacation club professionals have been tracked
11,803  unique TrackResults users.
7,805  active industry professionals currently being analyzed for performance
6,872  mail, daydrive, and OPC marketing venues rated
659 unique sales locations & call centers accessed our manifests.
123  domains deliver TrackResults marketing intelligence

58  attributes you can isolate or combine for instant intelligence
13  TrackResults Certified Marketers. 
7
  company professionals that assist you.
1 day required to train your whole team.
.01%  tolerance for bugs, slugs, lame ass reporting, and complacency.
ZERO ! The number of industry companies with our analytics capability. 

and a Partridge in a Peartree.
Happy New Year to the Timeshare Industry.
… Complacency : self-satisfaction especially when accompanied by unawareness of deficiencies 

  TrackResults software just returned from the 2nd annual event for  SMOV. Hosted at the Mayan Palace in Cancun, October 27 , this event included a Golf Scramble.and Tequila tasting party, Dinner hosted by Doug and Valentino at Tramonto’s  and lots of power networking.

Approximately 20 industry companies joined forces to raise funds in order to send Breast Cancer survivors on a much needed recovery vacation.

TrackResults Software Analytic’s staff was split into two teams for the golf scramble, and Todd’s foursome ( Included TravelToGo , CSA Travel Protection and Impact Marketing) officially took LAST PLACE.  New bonds were forged and old friendships renewed. A good time was had by all.

About SMOV : http://www.sendmeonvacation.org/

TrackResults Analytics is excited to see so many companies maturing in technology. This proactive approach allows aggressive capture of strategic advantages and larger market share, simply by applying  higher level analysis than your competitors.
Jesus Betanzos, : VP  Latin America BizDev, says, “The primary difference is the ability to easily apply multi-directional analysis to the reports used in the decision-making process.”

In their book “Com­pet­ing on Ana­lyt­ics,” Thomas Dav­en­port and Jeanne Har­ris empha­size the impor­tance of trust and cred­i­bil­ity between the ana­lyst and deci­sion maker. “Deci­sion mak­ers typ­i­cally don’t have the time or abil­ity to per­form analy­ses them­selves.With a ‘close, trust­ing rela­tion­ship’ in place,  exec­u­tives will frame their needs cor­rectly, the ana­lysts will ask the right ques­tions, and the exec­u­tives will be more likely to take action on analy­sis they trust.”

General report­ing only trans­lates raw data into infor­ma­tion, whereas  analytics trans­form data and infor­ma­tion into insights. Report­ing helps com­pa­nies mon­i­tor their online busi­ness and be alerted to when data falls out­side of expected ranges. Good analytics should raise ques­tions about the busi­ness from its end users.

One way to dis­tin­guish whether your orga­ni­za­tion is empha­siz­ing report­ing or analy­sis is by iden­ti­fy­ing the pri­mary tasks that are being per­formed by your ana­lyt­ics team. If most of the team’s time is spent on activ­i­ties such as build­ing, con­fig­ur­ing, con­sol­i­dat­ing, orga­niz­ing, for­mat­ting, and sum­ma­riz­ing — that’s report­ing.      The goal of TrackResults analy­tics is to help answer ques­tions by inter­pret­ing the data at a deeper level and pro­vid­e action­able indicators.

Analy­sis  focuses  on  dif­fer­ent  tasks such as ques­tion­ing, exam­in­ing, inter­pret­ing, com­par­ing, and validating.